Author: Ann Dadivas, Retired Academic Teacher, Writer, and Development Advocate
As a CEO, effectively communicating data and information to your employees and stakeholders is crucial in driving success for your business.
In the past, communication was limited to textual forms, but with the advancement of technology and the increasing complexity of data, new tools have become necessary to efficiently communicate and understand large amounts of information. This is where graphic design comes in.
Graphic design is vital in facilitating effective data and information communication. By utilizing design elements such as color, typography, and imagery, graphic designers can create visually appealing presentations that help convey complex information in a way that is easily understandable to a wide range of audiences.
Better Graphics for the CEO
As a CEO, visual representation of data can be crucial in communicating complex information to stakeholders, making informed decisions, and driving business success. Here are some popular graphic tools that can help you achieve this:
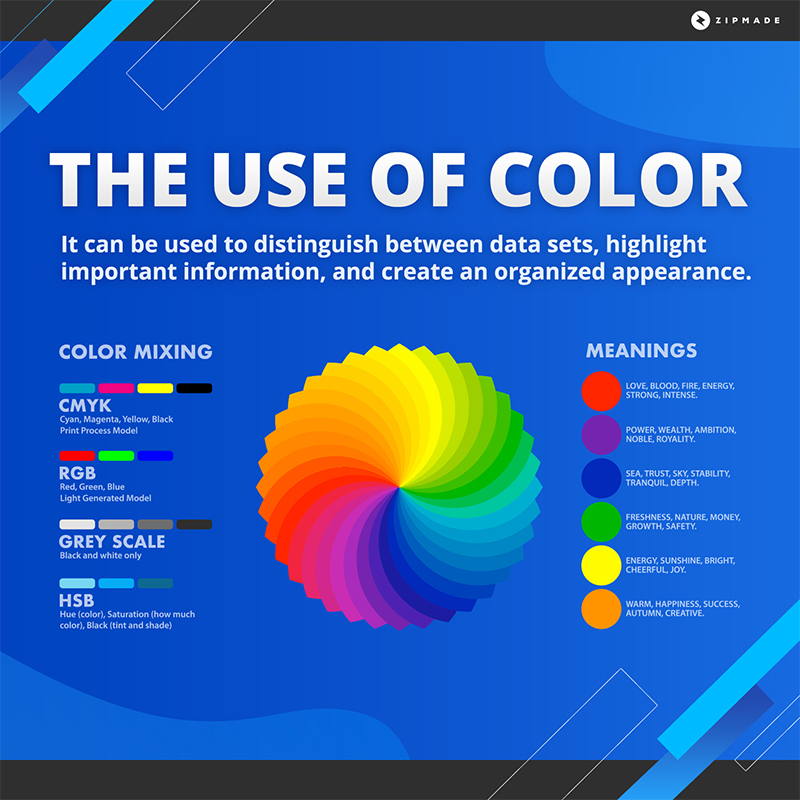
The Use of Color
One of the most important elements in graphic design is color. It can be used to distinguish between data sets, highlight important information, and create a sense of hierarchy within a presentation.
Using a consistent color scheme throughout a presentation can also help create a cohesive and organized appearance.
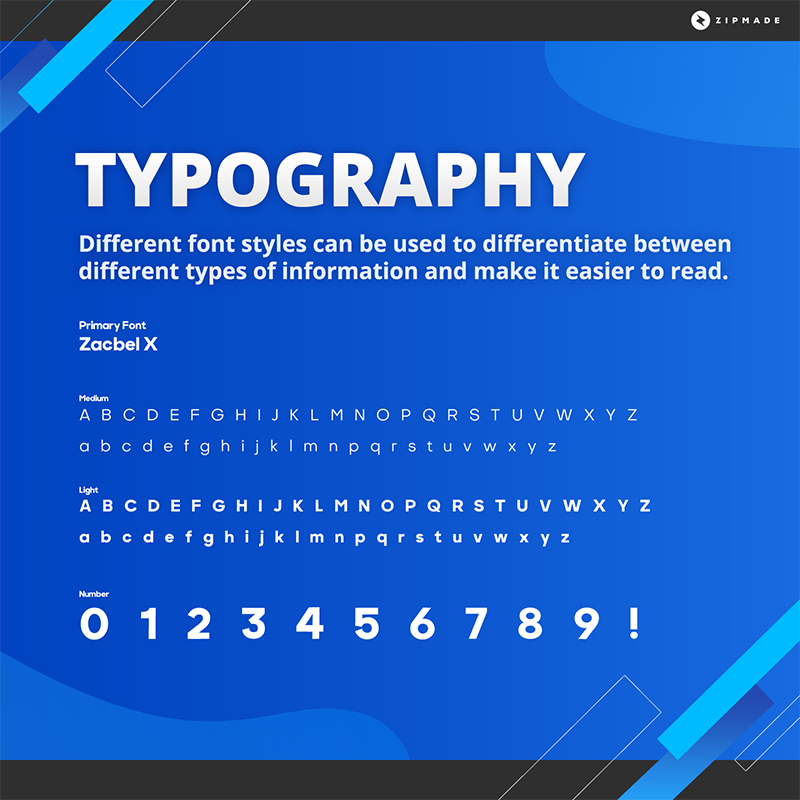
Typography
Typography, including the use of different font styles and sizes, is another crucial aspect of graphic design for data presentations.
Using larger font sizes for headlines and subheadings can draw the viewer’s attention and make important information stand out.
Different font styles, such as bold or italics, can also be used to differentiate between different types of information and make it easier to read.
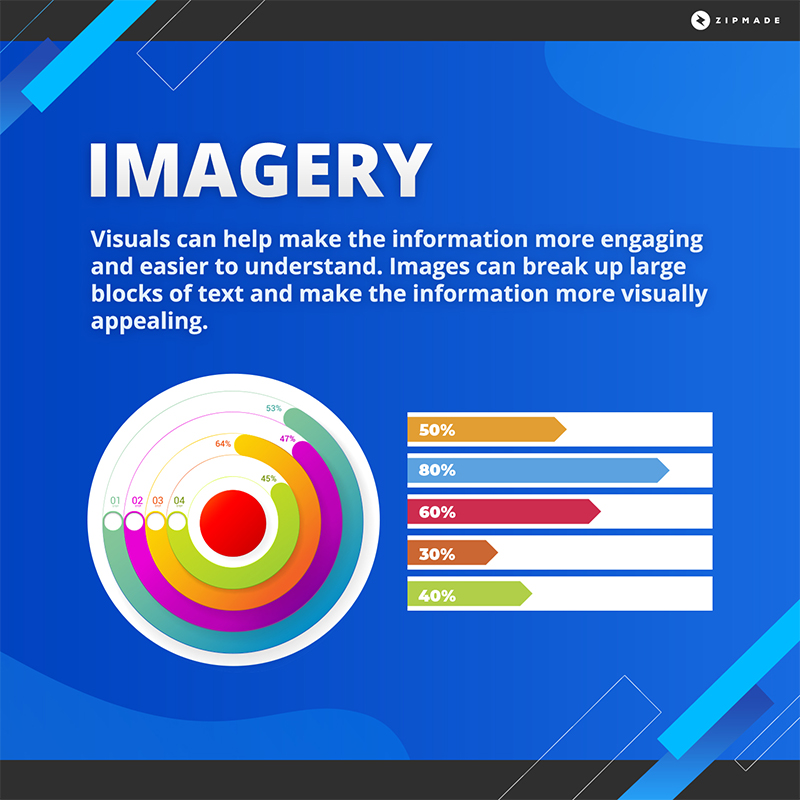
Imagery
Imagery, including charts, graphs, and infographics, is another element in graphic design that can greatly improve data presentations. These visuals can help make the information more engaging and easier to understand by enabling the viewer to compare different data sets and identify patterns or trends.
Furthermore, images can break up large blocks of text and make the information more visually appealing.
Projects where Graphic Design had Proved Effective
There have been numerous examples of the effectiveness of graphic design in data communication. For instance, the “Cancer Atlas” created by the International Agency for Research on Cancer used a combination of maps, charts, and infographics to present data on cancer incidence and mortality rates in a clear and visually appealing manner.
The use of color and typography effectively conveyed the information and made it more engaging and easier to understand.
The “Climate Clock” created by designer Nickolay Lamm is another example. It used real-time data and graphic design elements to communicate the urgency of climate change.
Graphic Design as a Story-Telling Technique
Graphic design can also be used as a storytelling technique to create a narrative in a data presentation. Giorgia Lupi, the co-founder of Accurat, a data-driven design agency, is a notable example of using storytelling in her data visualization work.
Through projects such as “Dear Data” and “How We Feel,” she used data visualization to create a narrative and tell a story.
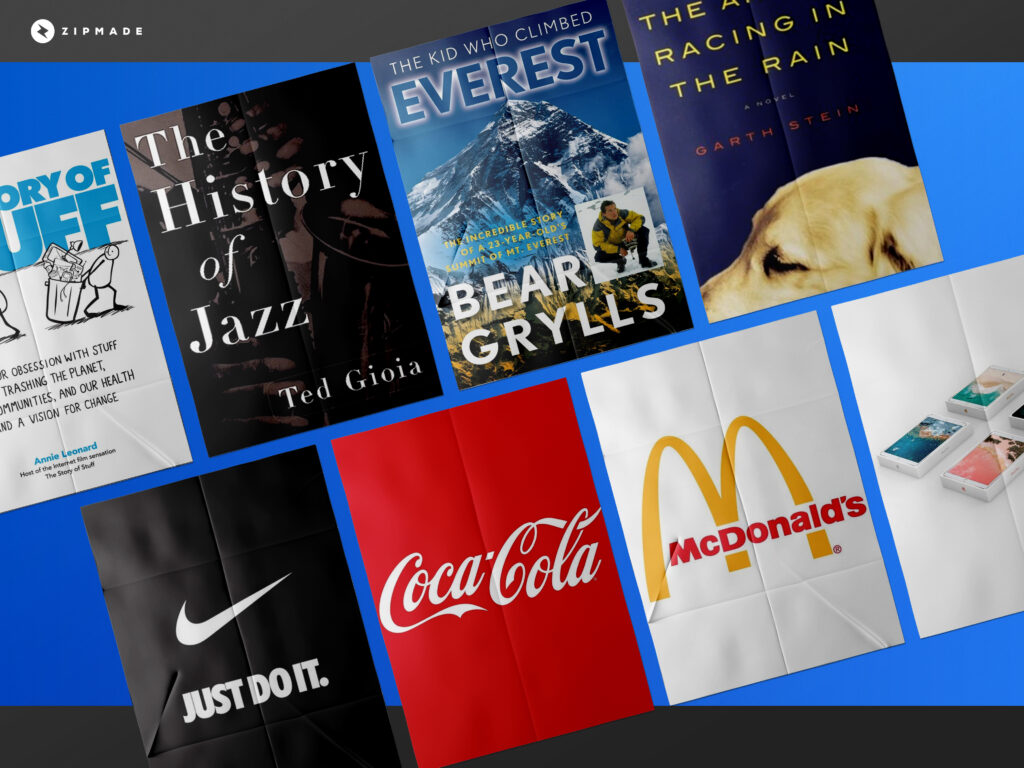
“The History of Jazz” by Stephen Wilson used illustrations and typography to tell the story of the development and evolution of jazz music.
“The Kid Who Climbed Everest” by Bear Grylls, an illustrated children’s book, used vibrant illustrations and creative typography to tell the story of a young adventurer’s journey to the top of Mount Everest.
“The Art of Racing in the Rain” by Garth Stein was a novel presented in a unique format using illustrations and typography to complement the storytelling and bring the narrative to life.
“The Story of Stuff” by Annie Leonard was a short film that used animated graphics and illustrations to visually tell the story of the life cycle of consumer goods and their impact on the environment.
“Healthy Habits” by Movellas was an infographic series that used illustrations, charts, and typography to tell the story of healthy habits and the positive impact they can have on one’s life.
These examples show that graphic design can be used to effectively tell a wide range of stories and make complex information easier to understand.
Graphic Design Increases Sales!
There appear to be endless possibilities for the benefits of using graphic designs in various real-life applications! For CEOs, its ultimate benefit is increasing sales! Here are a few cases where the use of graphic design has produced good sales figures.
The Apple’s Product Packaging. Apple’s minimalist and elegant product packaging has been credited with helping to boost sales and create a sense of exclusivity and luxury for its products. The sleek design of the packaging and the way it showcases the product has become a hallmark of the brand.
The Coca-Cola’s Red and White Logo. Coca-Cola’s iconic red and white logo is one of the most recognizable logos in the world. The design has helped the company to establish a strong brand identity and increase sales by making the product easily recognizable and memorable.
Nike’s “Just Do It” Campaign. Nike’s “Just Do It” campaign, with its bold and simple design, has been credited with helping to increase sales by appealing to customers’ emotions and a sense of determination. The slogan and design have become synonymous with the brand and have helped to create a strong and recognizable brand identity.
McDonald’s Golden Arches. McDonald’s golden arches logo is another example of graphic design being used to increase sales. The simple and recognizable design has become a brand symbol and has helped increase sales by making the product easily recognizable and memorable.
Procter & Gamble’s Tide Pods. The bright and eye-catching packaging of Procter & Gamble’s Tide Pods has been credited with helping to increase sales. The design of the packaging makes the product stand out on store shelves and draws the customer’s attention, making it more appealing and easier to find.
Closing
In conclusion, graphic design is essential in effectively communicating data and information. As a CEO, investing in graphic design services can greatly increase the impact and effectiveness of your data presentations, resulting in a higher potential for sales and success for your business.
Are you a CEO or a business head who needs impressive graphics for presentation and brand-building purposes? Creating the graphics by yourself can take hours of your day away from your business and personal time. Hiring a graphic designer can do wonders but can you find the right one that captures what you need?
Try Zipmade and take advantage of our 15-Day full-refund policy. Subscribe to Zipmade and we will handle all your graphic design needs.